Use Cases
Graph Analysis: Friend Recommendation
On platforms such as social networking and e-commerce websites, recommendation systems are often used to provide users with various recommendations, such as friend recommendations, product recommendations, etc. Among the numerous recommendation algorithms, PageRank is widely used and is more efficient when applied to graph data.
As shown in the figure below, in a business database (such as MySQL), user information (PERSON) and the following information between users (KNOWS) are stored.
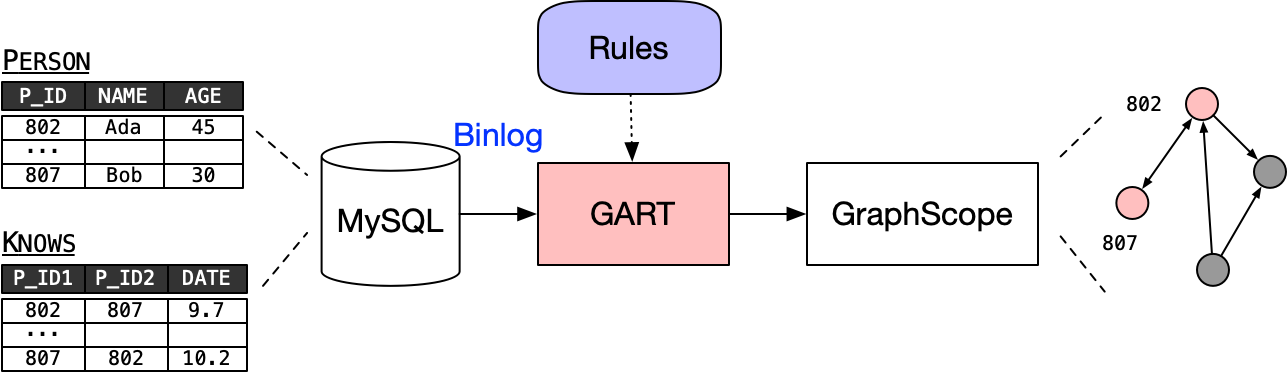
Illustration of the friend recommendation use case.
Whenever there are new users and new follows (as well as modifications and deletions), these will be executed on this database. To perform friend recommendations for users, it is necessary to apply the PageRank graph computation algorithm on this dataset. However, operating graphs directly in a relational database is inefficient, resulting in a large number of join operations. GART captures the changes in data by fetching the binary log (binlog) from MySQL.
During the use of GART, changes in data from the relational database are transformed into updates of graph data according to the user-defined model mapping rules. In this way, the graph data can reflect changes in real time, and dynamic graph storage provided by GART allows the use of the graph computing engine (GraphScope) to perform PageRank calculations, similar to how a static graph is accessed.
These model transformation rules include the user’s definition of the graph structure and how information in the relational data is mapped to the vertices, edges, and attributes in the graph.
Graph Traversal: Business Intelligence
This example is a more complex Business Intelligence (BI) scenario, and BI scenarios involve more complex graph topological relationships and properties of points and edges. The following figure shows the definition of the graph structure under the LDBC-SNB benchmark:
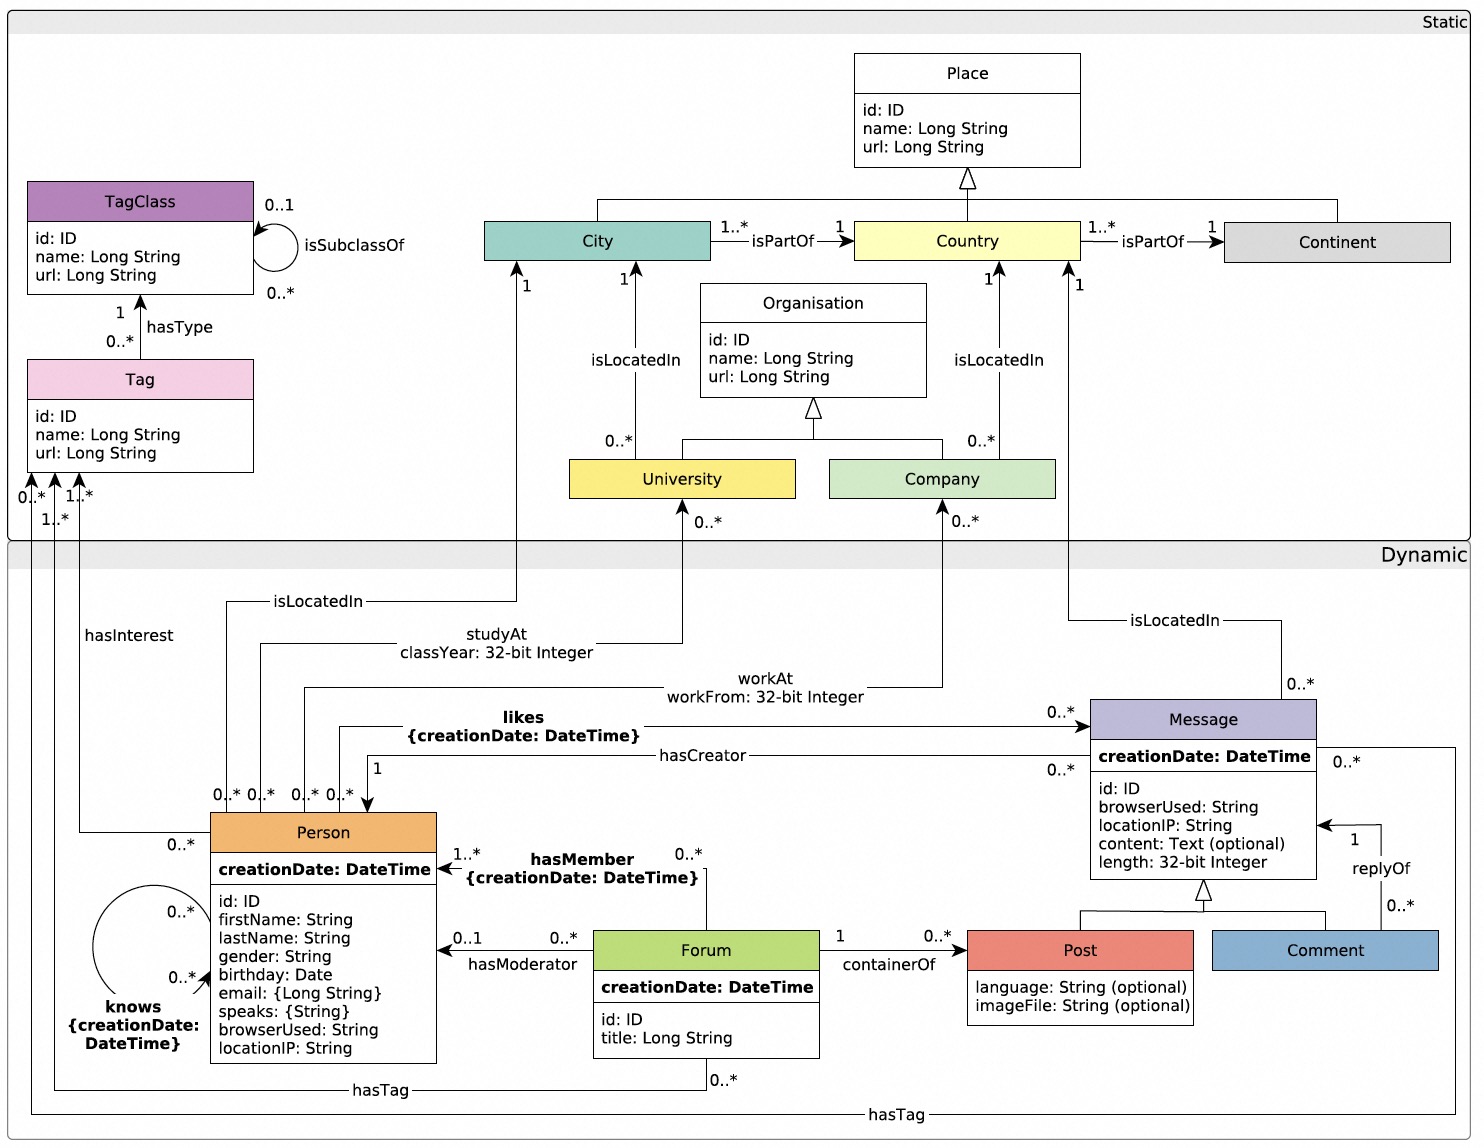
Illustration of the LDBC-SNB use case.
In particular, the vertices and edges in the Dynamic region in the lower half of the schematic diagram will be updated dynamically as the business evolves. There will also be a series of complex queries on the graph for analysis, such as the most popular topics in a certain region, related topics analysis, etc. The update of business data can be reacted to the graph storage through GART and analyzed by the graph computing engine for BI queries.